KEY GENDERED PROFESSIONAL PERCEPTIONS TO KNOW
Gender and Power by Rich Morin and D'Vera Cohn, Pew
Research Center September 25, 2008
Gender Roles in Positions of Authority
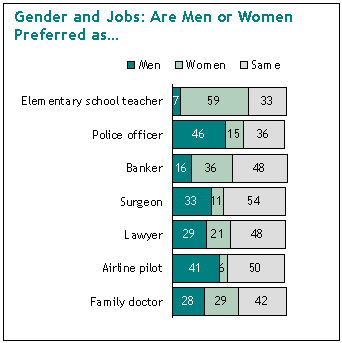
While many Americans say it makes no difference to them whether they deal with a man or woman in a range of high-profile positions of authority, the survey finds that they retain strong traditional gender preferences in a few positions, including elementary school teacher and police officer. The other positions tested were banker, surgeon, lawyer, airline pilot and family doctor. Here is a rundown of the public's responses, based on interviews with the full sample of 2,250 adults.
Traditional roles
Most of the nation's elementary school teachers are female, most police officers are male, and Americans generally prefer it that way. This attitude is especially prevalent when it comes to elementary school teachers; majorities of both genders and all race and age groups say they would rather deal with a woman than a man in that role.
Among Americans of different education levels, college graduates are the only group in which there is not a majority preference for female teachers; they split their opinions evenly between female and no preference.
Asked about the preferred gender for police officer, Americans give a plurality of votes- 46%- to males. Although men are slightly more likely than women to prefer female teachers, there is no difference between the genders in their preference for policemen.
But Americans 65 years old or older are more inclined than younger adults to prefer a male policeman - 55% do, which is at least eight percentage points more than is the case with any younger age group.
Although no demographic group prefers a female police officer, one in four black or Hispanic Americans say they would rather deal with a policewoman, compared with 12% of whites.
Surgeons and Airline Pilots
Surgeons and airline pilots are traditionally male occupations that remain heavily male, but half or more of Americans say it makes no difference to them whether a man or woman holds those jobs.
Majorities of men (57%) and women (52%) say they have no preference for a male or female surgeon. A third of men (32%) and women (34%) say they prefer a man, and the rest prefer a woman. Older people are most likely to prefer a male surgeon. Blacks, and to a lesser extent Hispanics, are more likely than whites to prefer a male surgeon.
When it comes to airline pilots, men (53%) are somewhat more likely than women (47%) to say they have no preference. Men (38%) are less likely than women (44%) to prefer a male pilot. Hispanics (53%) and blacks (49%) are more likely than whites (38%) to prefer that their pilot be male. Older Americans also are more likely to prefer a male pilot, women more so than men.
Family doctor
Gender differences play a role in preferences for a male or female family doctor, a traditionally male field that has been attracting growing numbers of females. Men are most likely to express no preference (46%), but a notable share prefers a male doctor (35%). Women split their votes between no preference (38%) and a female doctor (39%).
Age also plays a role: Older Americans are more likely to prefer a man, while younger ones are more likely to prefer a woman.
Banker and Lawyer
The financial services and legal professions also are traditionally male, but increasingly populated by women. About half of Americans (48%) say they have no preference between a male or female banker or lawyer. This is especially true of whites, college-educated Americans and high-income respondents. People who live in the West also are most likely than Americans in other regions to have no preference for a male or female banker or lawyer.
After "no preference," though, Americans' second choice for their banker would be a woman (36%), which is true for both male and female respondents. Younger people are more evenly split between expressing no preference and favoring a woman. Older people are somewhat more likely to prefer a man to a woman.
Some groups are more likely to prefer a woman to a man or to the no-preference option. They include blacks and Hispanics (47% of each favors a woman banker), as well as Americans who have not graduated high school or who are in the lowest income group. Notably, even Americans who say they believe women should return to their traditional roles say they prefer a woman (37%) to a man (23%) for their banker.
As for their lawyer, men (51%) are slightly more likely than women (46%) to express no preference. Men (28%) and women (30%) are about equally likely to prefer a male lawyer. Women (23%) are somewhat more likely than men (18%) to prefer a female lawyer.
There are racial differences in lawyer preference. Most whites (54%) say gender doesn't matter. Hispanics and blacks are more likely than whites to split their votes among men, women or no preference. A narrow majority of middle-aged Americans (30-49 and 50-64) say they have no preference, compared with four-in-ten of younger or older Americans. Younger and older Americans cast more of their votes for male lawyers than do middle-aged Americans.
Sub-Group Preferences
In general, older Americans are most likely to prefer men in traditionally male jobs. Blacks and Hispanics are more likely than whites to favor men in some traditionally male jobs, but tilt toward women in others. College graduates are more likely than less-educated Americans to express no job preference for either gender.
There's very little difference between male and female survey respondents over which gender they would rather deal with in each profession tested. The lone exception to this pattern is the family doctor. Here, gender solidarity prevails. Female respondents express a preference for a woman doctor by a ratio of nearly two-to-one, while male respondents say they would prefer to deal with a male family doctor by a ratio of about two-to-one.
Find the methodology and topline questionaire at pewsocialtrends.org.